Newsletter Search Engine
Total 314998 mails
livingsocial
GB
·
2026-6-13
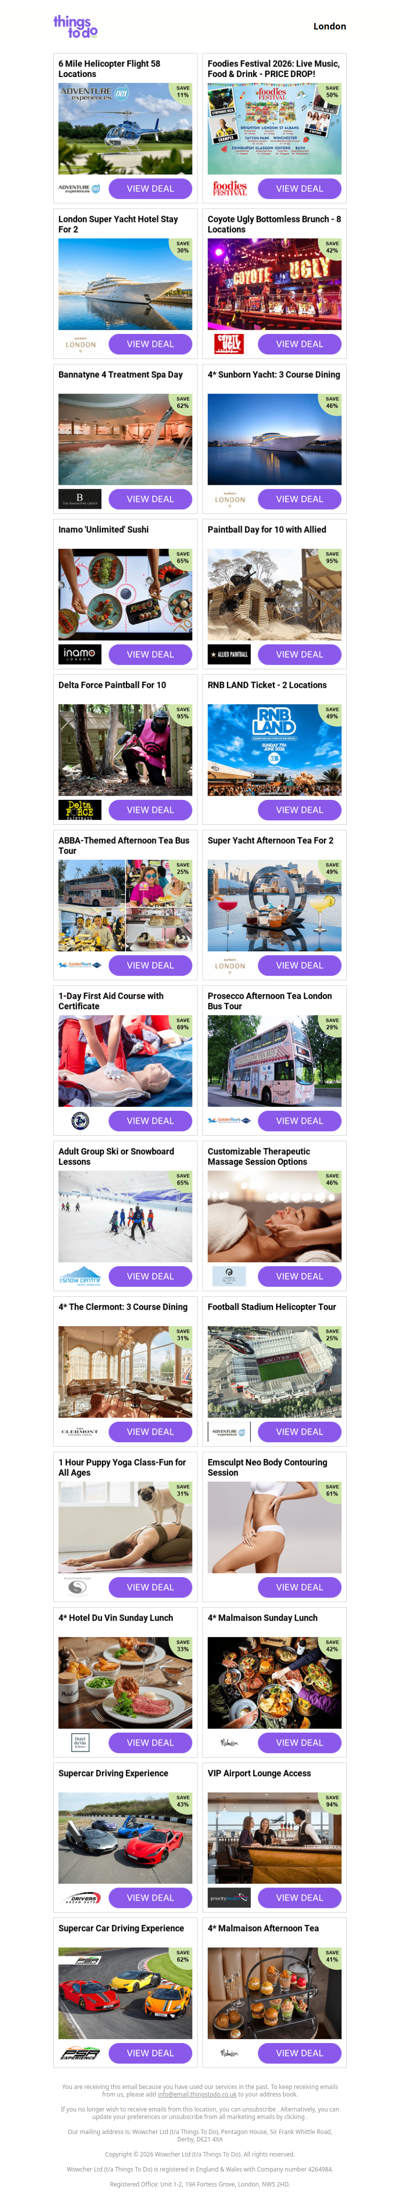
6 Mile Helicopter Flight 58 Locations | Foodies Festival 2026: Live Music, Food & Drink - PRICE DROP! | London Super Yacht Hotel Stay For 2 | Coyote Ugly Bottomless Brunch - 8 Locations | Bannatyne 4 Treatment Spa Day
looksharpstore
NZ
·
2026-6-13

1 Hour Massage - 4 Locations - PRICE DROP! | BYOB 90-Min Ultimate Pottery Making & Painting - PRICE DROP! | London Super Yacht Hotel Stay For 2 | Top View London Sightseeing Bus Tour | Steam Train Ride & Cream Tea Experience

xeirokamoto
GR
·
2026-6-13
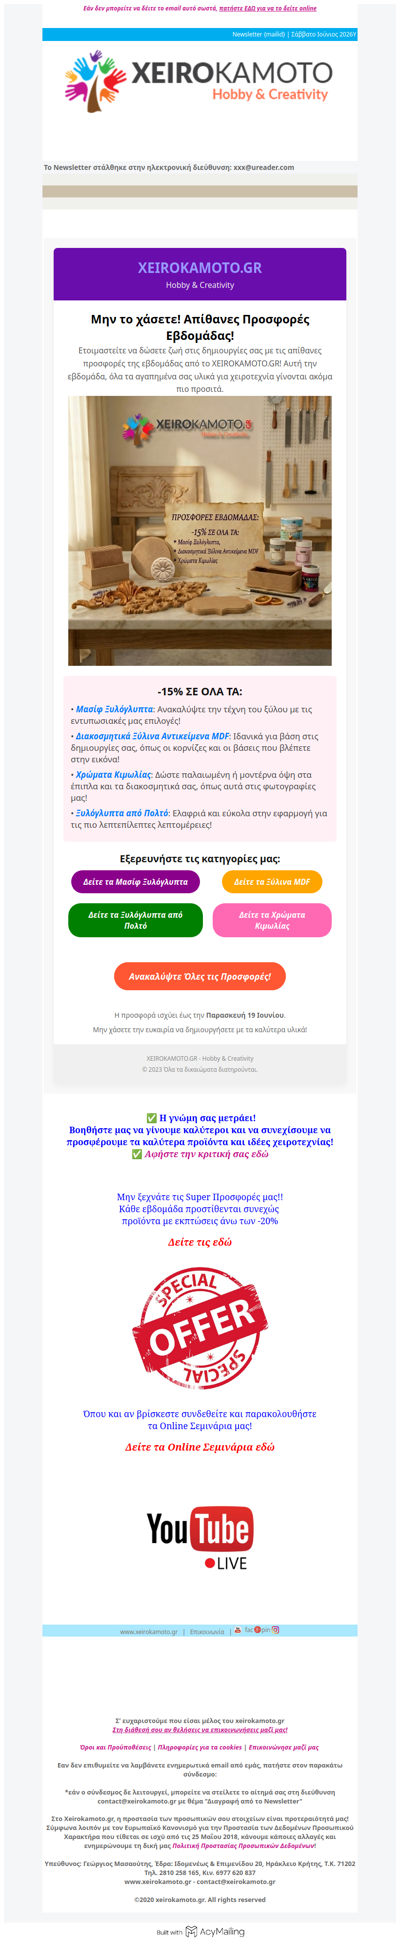
Προσφορά εβδομάδας -15% στα Ξυλόγλυπτα από μασίφ, Ξύλα MDF και όλα τα χρώματα Κιμωλίας